

Canada’s population continues to grow, but not evenly across the country. Understanding the population of Canada by province helps explain where growth is happening, how demographics are shifting, and what this means for housing, infrastructure, and public services. These population patterns also shape cultural markers such as language, identity, and even common Canadian names, which often vary by region, migration history, and generation.
This guide breaks down Canada’s population by region, age, and urban concentration using the latest available data.


Overview of Canada's Population Distribution
Canada’s population is unevenly distributed across provinces and territories. According to Statistics Canada’s population estimates, Ontario, Quebec, British Columbia, and Alberta account for the majority of Canada’s population, while the territories and many northern regions have comparatively small population totals.1
Population growth is also concentrated in major census metropolitan areas such as Toronto, Vancouver, Montreal, Calgary, and Edmonton. In contrast, many rural and remote regions experience slower growth or remain relatively stable over time. These patterns reflect long-standing settlement trends as well as ongoing migration between provinces and toward larger urban centres.
More than 85% of Canadians live in urban areas, and over half of the population lives in just four provinces: Ontario, Quebec, British Columbia, and Alberta.
National Population Trends
Population change in Canada today looks very different than it did a few decades ago. Slower birth rates and longer life expectancy mean that natural growth now plays a smaller role, especially as the population of Canada by age continues to tilt older. Instead, population growth is increasingly shaped by movement, both into and within the country. While the Canada emigration rate has risen in recent years, it has not outweighed incoming flows, leaving overall population levels on an upward path.
Where that growth shows up also matters. The population of Canada by city continues to expand faster than smaller communities, with major population of Canada cities attracting the bulk of new residents. This urban focus helps explain why Canada’s growth pattern differs from other countries.
Importance of Provincial Population Data
Looking at Canada’s population at a national level only tells part of the story. Population trends can vary widely from one province to another, which is why provincial data is essential for decision-making. Governments rely on population by province to plan healthcare capacity, schools, transportation, and housing, while businesses use it to assess labour availability, consumer demand, and regional growth potential.
Provincial population data also helps identify where growth is accelerating, where populations are aging faster, and where pressures on services may increase.
Population by Province
Looking at the population of Canada by city and region highlights just how different population patterns are across the country. Some provinces are shaped by large urban centres with dense populations and diverse demographics, while others are defined by smaller cities, rural communities, and slower growth.
| Province | Population (Q4 2025) | Most populated city | Average Household Income | Spoken language | Average age | % of the Canadian population |
|---|---|---|---|---|---|---|
| Ontario | 16,191,372 | Toronto | $82,400 | English (86.4%) French (3.8%) Other (9.8%) | 41 years | 41.8% |
| Quebec | 9,058,089 | Montréal | $76,800 | French (77.5%) English (13.0%) Other (9.5%) | 42 years | 23.6% |
| British Columbia | 5,683,201 | Vancouver | $84,100 | English (84.2%) Chinese (8.1%) Other (7.7%) | 42 years | 14.8% |
| Alberta | 5,040,871 | Calgary | $84,700 | English (81.8%) French (1.8%) Other (16.4%) | 38 years | 12.7% |
| Manitoba | 1,507,057 | Winnipeg | $71,900 | English (89.8%) French (3.2%) Other (7.0%) | 39 years | 3.9% |
| Saskatchewan | 1,266,234 | Saskatoon | $88,600 | English (85.6%) French (1.6%) Indigenous (2.8%) Other (10.0%) | 39 years | 3.2% |
| New Brunsvick | 868,630 | Moncton | $65,400 | English (65.3%) French (31.8%) Other (2.9%) | 45 years | 2.2% |
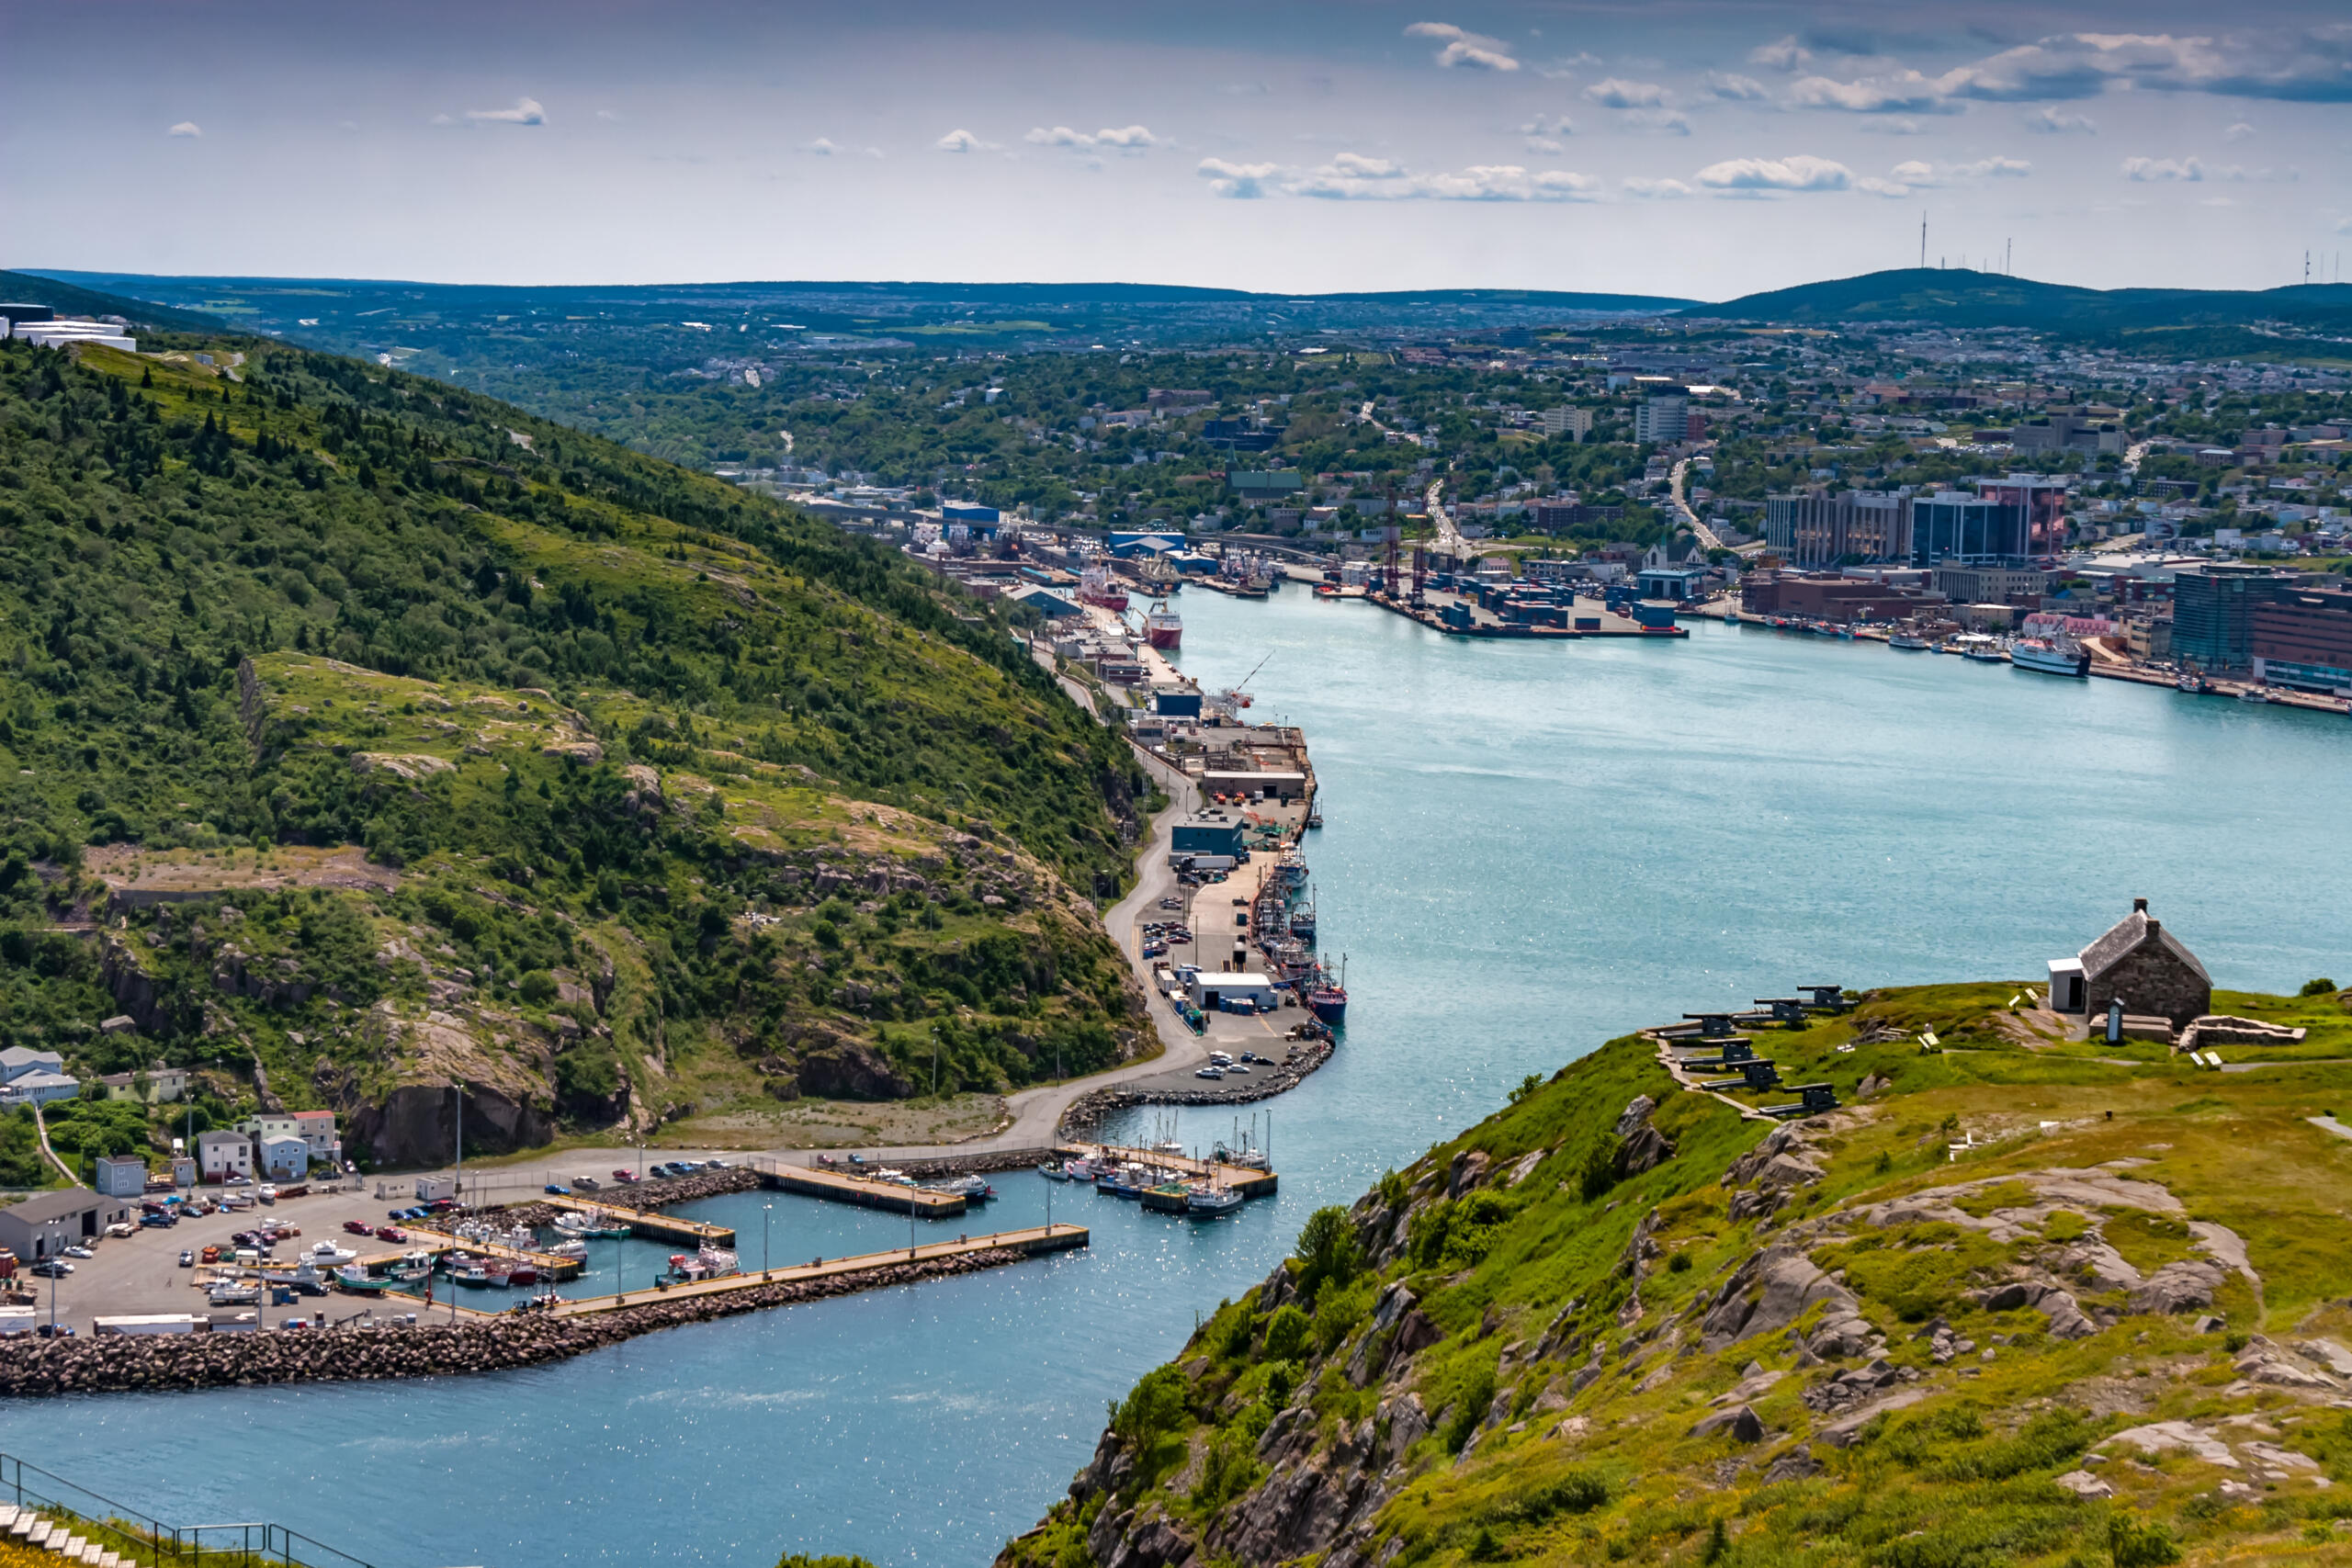
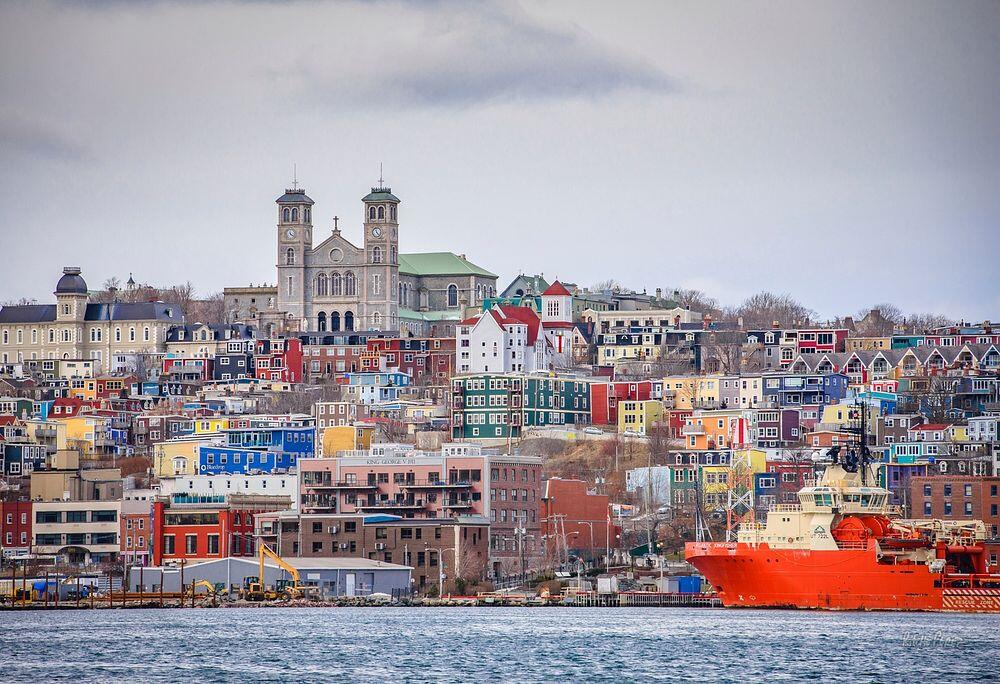
| Newfoundland and Labrador | 549,738 | St. John's | $63,800 | English (97.2%) French (0.5%) Other (2.3%) | 46 years | 1.4% |
| Prince Edward Island | 182,508 | Charlottetown | $76,200 | English (93.8%) French (3.6%) Other (2.6%) | 43 years | 0.5% |
| Yukon | 48,261 | Whitehorse | $105,600 | English (84.8%) French (4.4%) Indigenous (1.8%) Other (9.0%) | 39 years | 0.1% |
| Northwest Territories | 45,848 | Yellowknife | $88,700 | English (77.5%) Indigenous Languages (19.2%) French (2.3%) Other (1.0%) | 34 years | 0.1% |
| Nunavut | 41,919 | Iqaluit | $73,400 | Inuktitut (65.3%) English (31.6%) French (1.8%) Other (1.3%) | 27 years | 0.1% |
Ontario
Ontario is Canada’s most populous province and home to nearly 40% of the country’s population. Its size is largely driven by strong urban growth and a dense network of major cities.
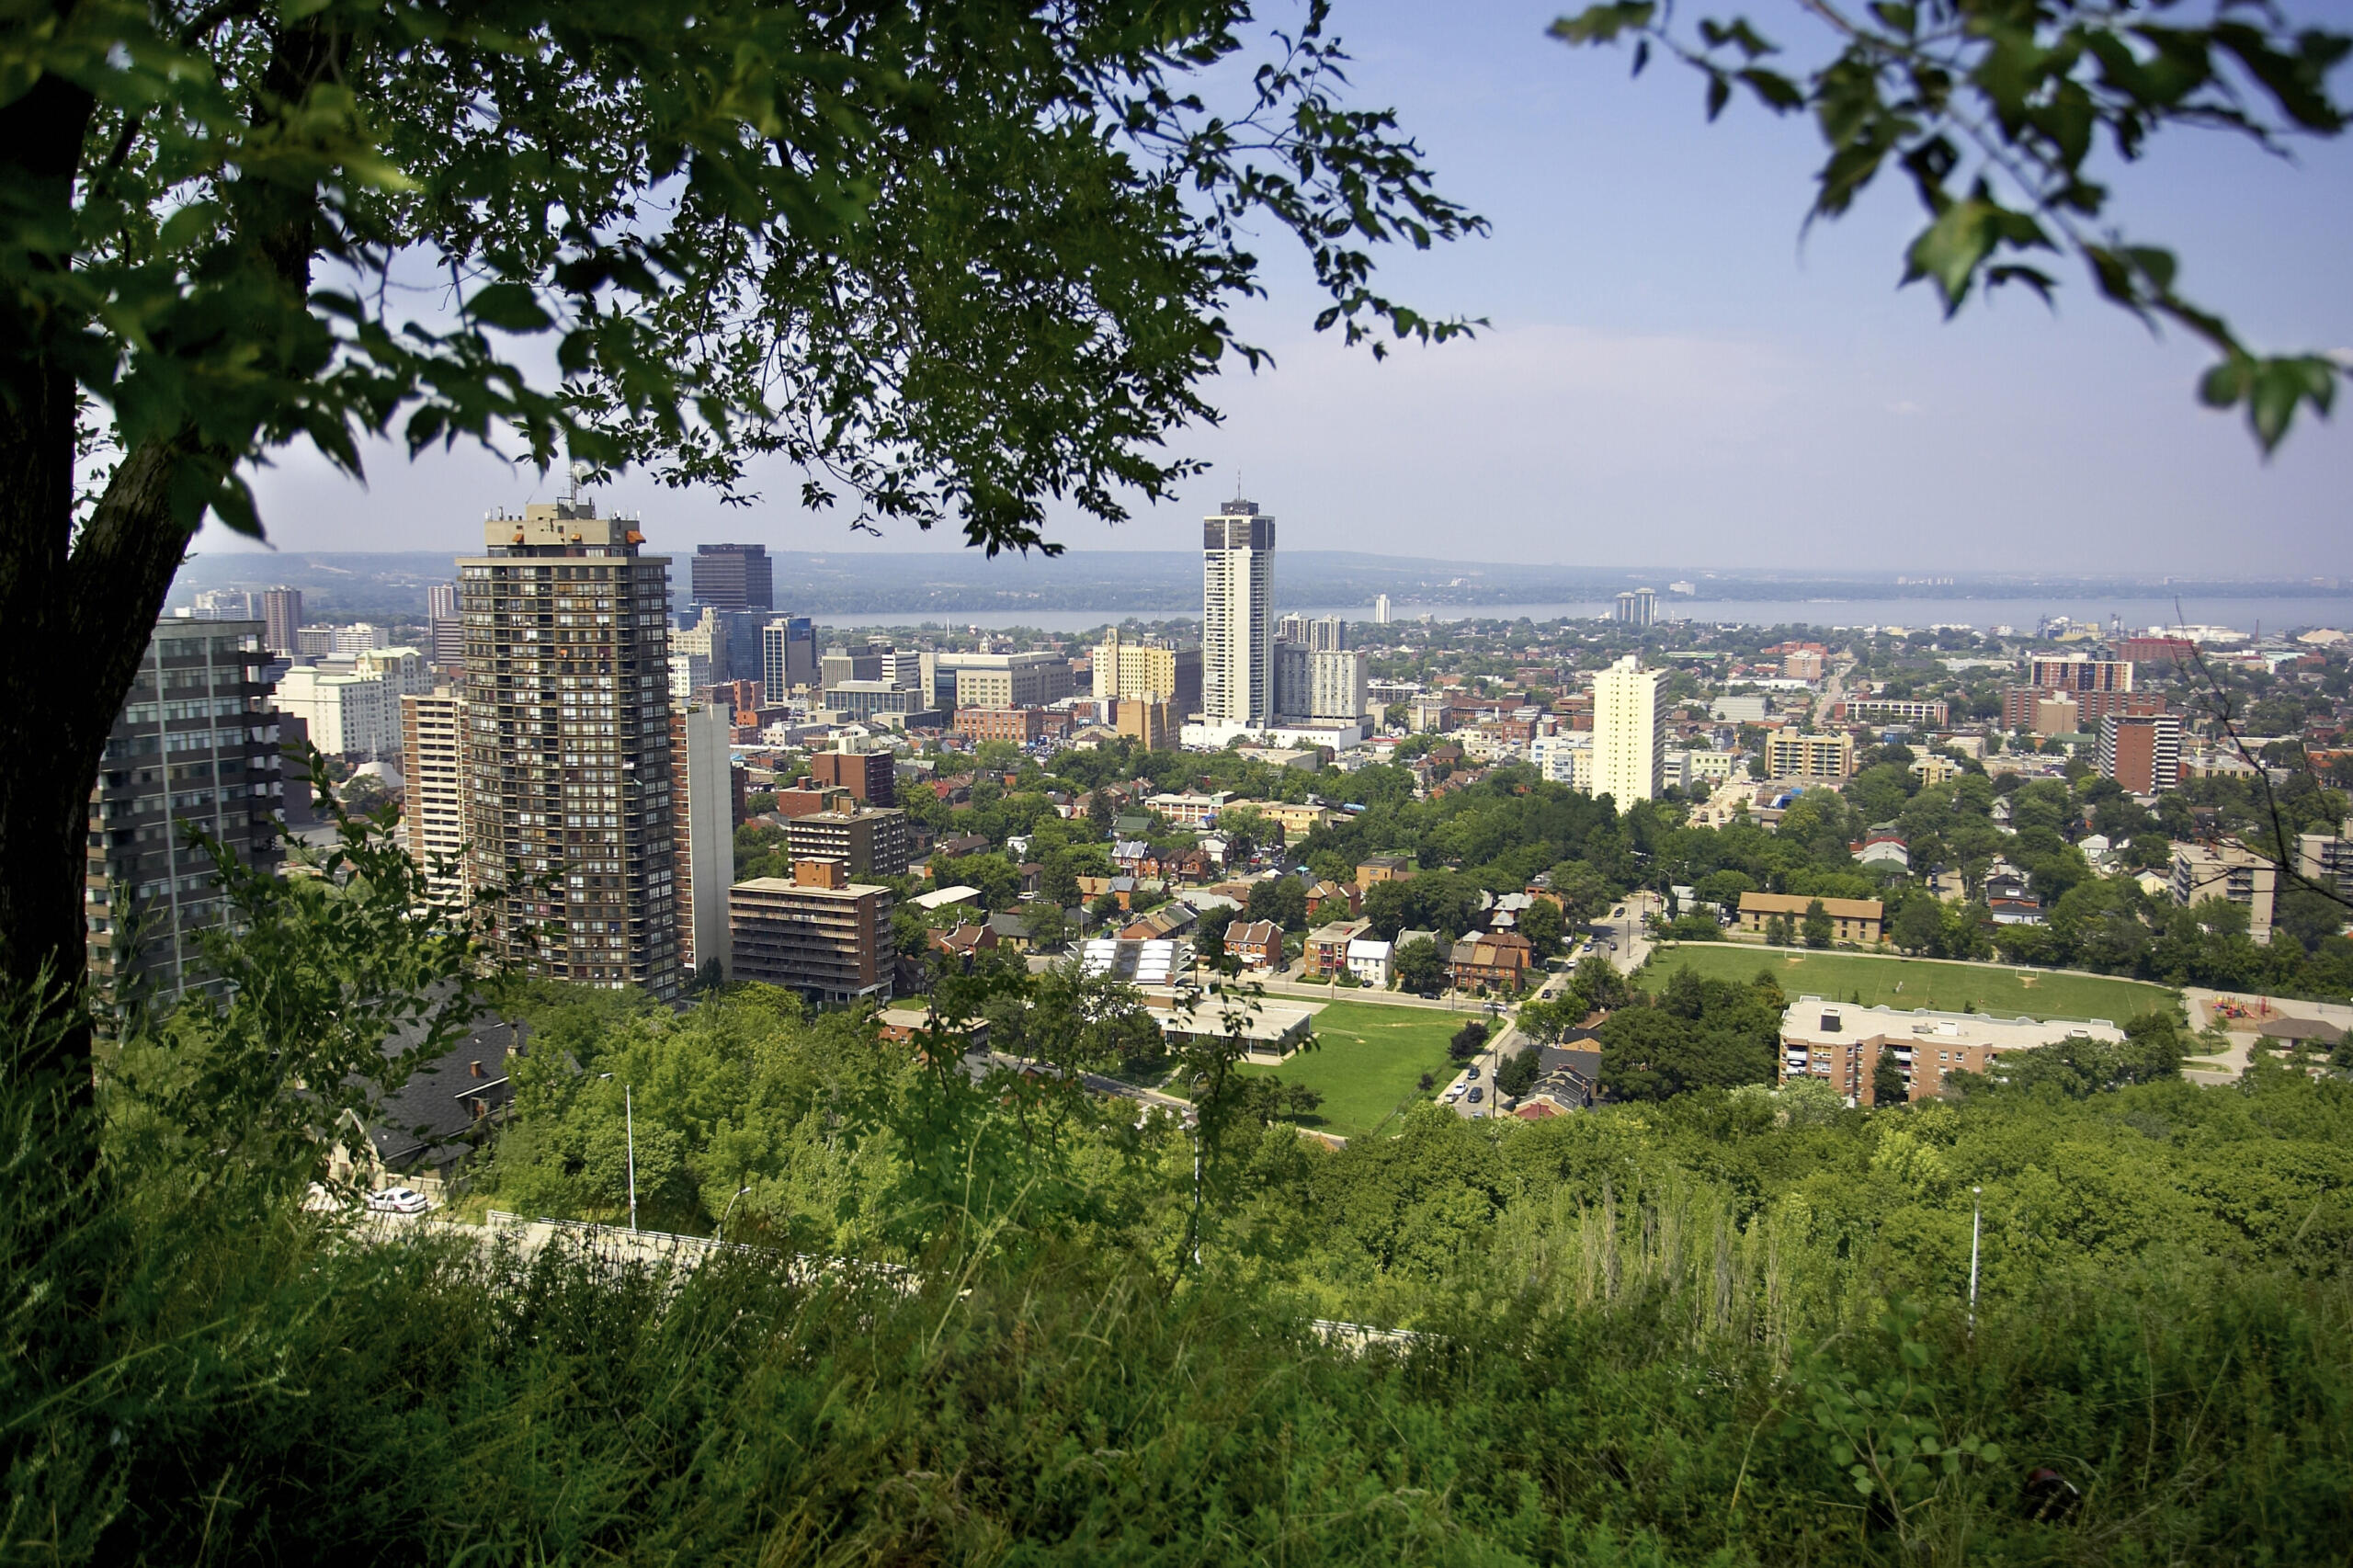
When looking at the population of Canada cities, Ontario clearly stands out, with Toronto, Ottawa, Brampton, Mississauga, and Hamilton leading the way. The average age in Ontario is 41, placing it close to the national average and reflecting a mix of working-age adults, families, and seniors.


This age balance, combined with a high concentration of universities and job opportunities, helps explain why Ontario attracts a large share of the Gen Z population in Canada, particularly in and around major urban centres.
The province also has a diverse and relatively balanced population. Ontario is one of the most culturally diverse regions in Canada, with large South Asian, Chinese, Black, and Filipino communities.
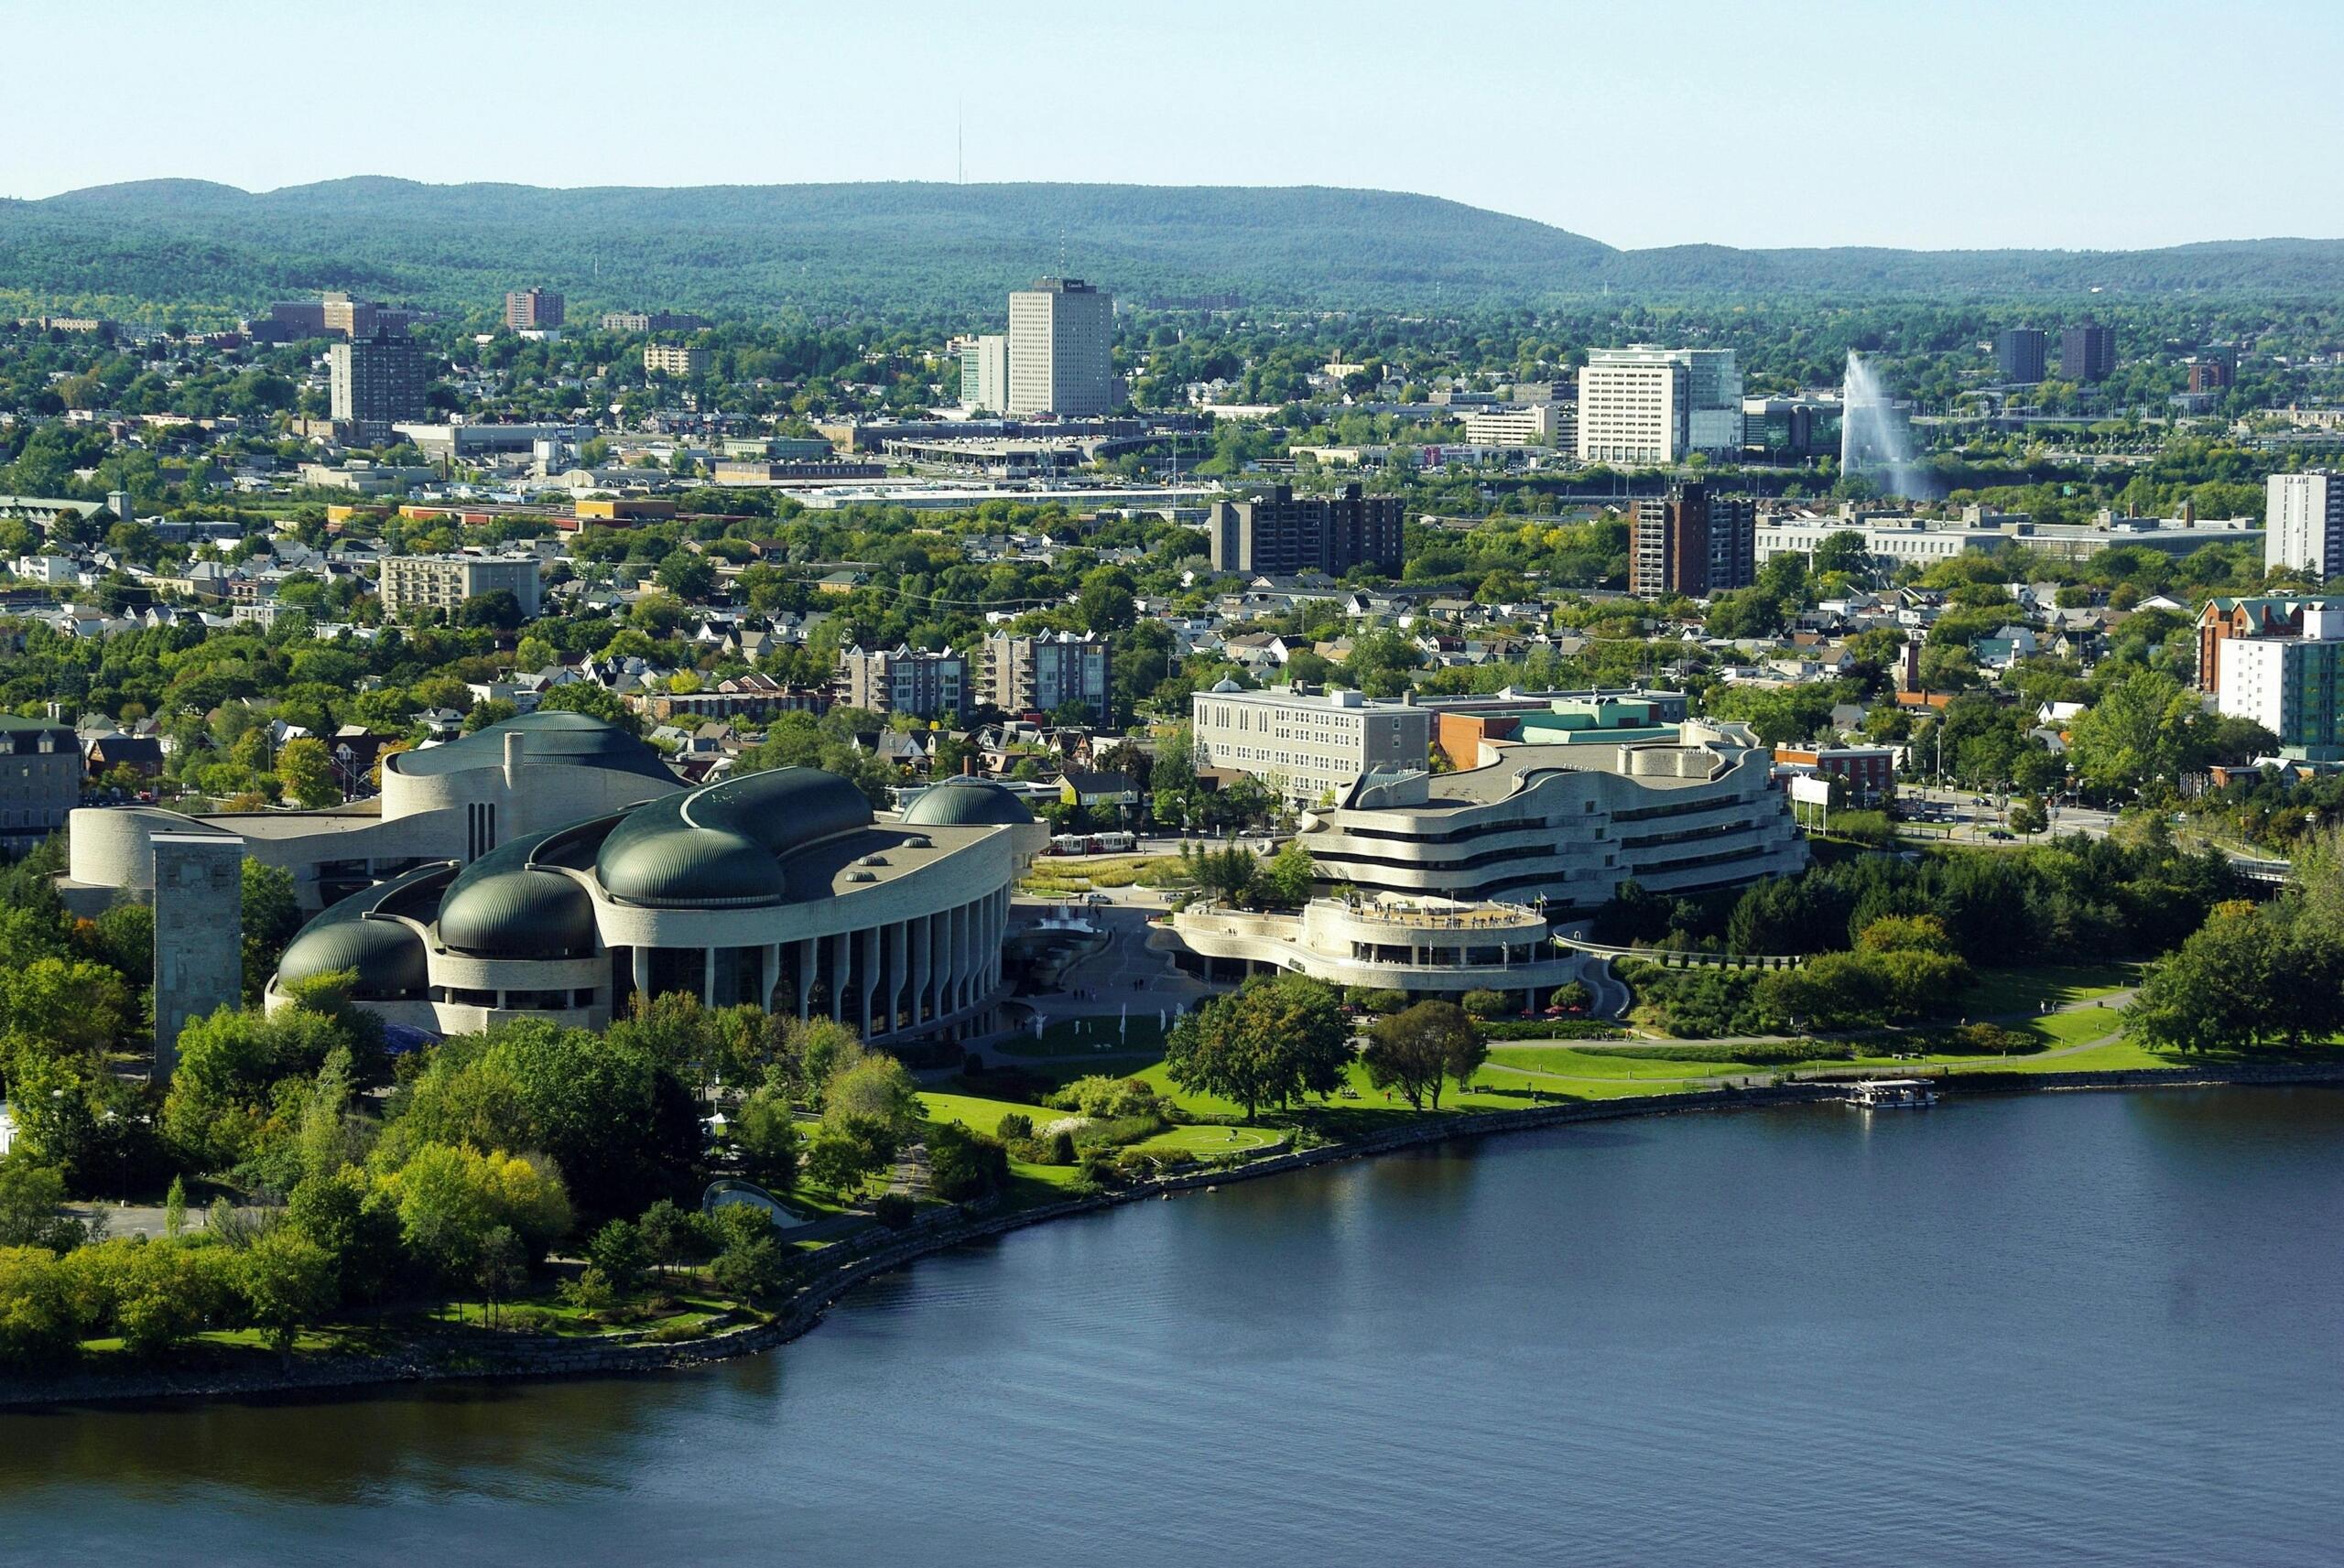
Quebec
Quebec’s population is heavily centred around its main cities. Montréal is the largest by far, with Québec City, Laval, Gatineau, and Longueuil following behind. These urban areas are where most people live, work, and study, and they continue to shape everyday life in the province.
It accounts for just under a quarter of the national population and has a population structure that is slightly older than the Canadian average.

When looking at the population of Canada by age, Quebec stands out for having a higher median age, reflecting long-term demographic trends and slower natural growth.
The population is also fairly balanced by gender, with women making up just over half of residents. French is the main language for most households, which gives Quebec a strong cultural identity that sets it apart from other provinces.
of Canadians speak French
At the same time, growing immigrant communities add to that mix, especially in larger cities. Combined with a slightly older average age, this creates a population that is both stable and deeply shaped by culture, language, and long-standing settlement patterns.
British Columbia
British Columbia is Canada’s third-most populous province and the largest on the West Coast. Most people in British Columbia live in the southern and coastal areas, where the climate is milder and cities are more concentrated.
And when looking at the population of Canada cities, Vancouver and the surrounding Metro Vancouver area stand out as the main population centre, followed by fast-growing cities like Surrey and Burnaby.
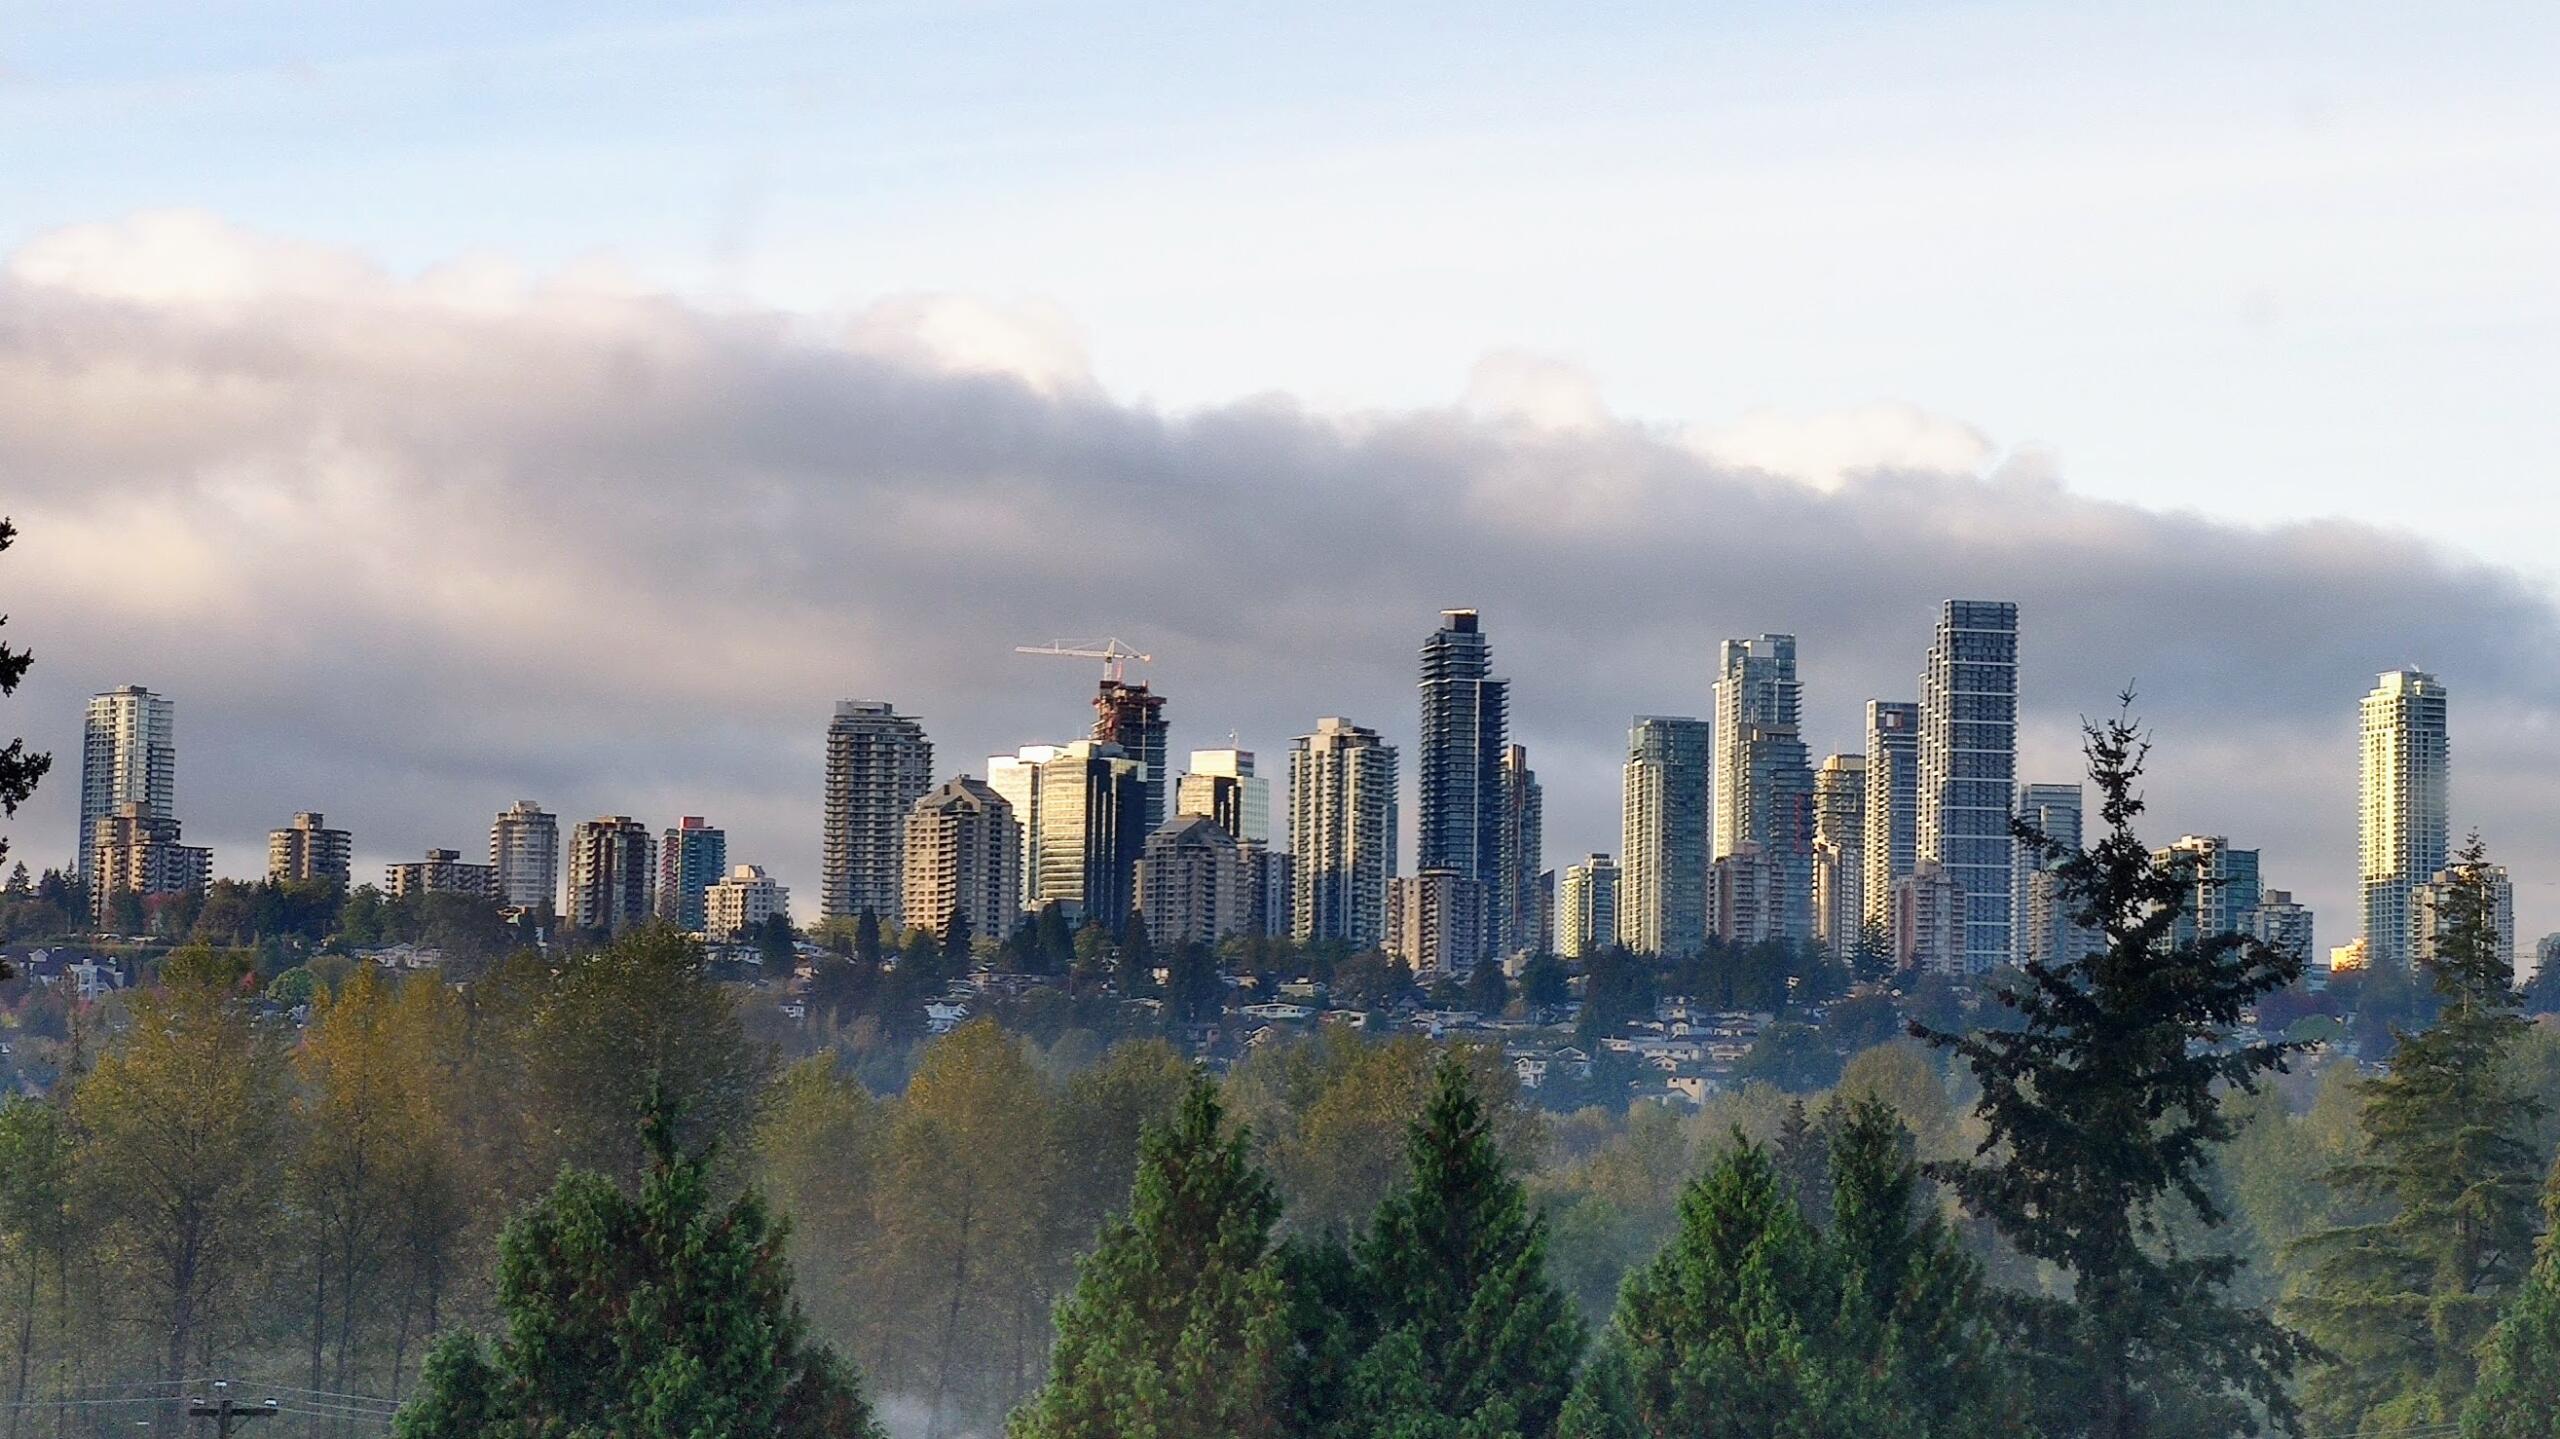


The province has a balanced gender split and a slightly older population overall, with an average age of 42. British Columbia is also one of the most diverse provinces in Canada, particularly in urban areas, where large Chinese, South Asian, and Filipino communities are well-established.
Alberta
Alberta is one of Canada’s fastest-growing provinces and accounts for about 12.7% of the country’s total population. The province continues to attract people from other cities and provinces thanks to strong labour markets, especially in energy, construction, and professional services. Compared with the average Canada household income, Alberta consistently ranks on the higher end, which helps explain its strong pull for working-age Canadians.
Alberta’s household incomes are higher than the national average, with an average household income of $84,700 and a median income of $72,500 and about 11.3% of residents live below the poverty line.
Alberta also stands out demographically. The average age is 38, making it one of the youngest provinces in Canada. This younger profile helps explain why Alberta attracts students, young professionals, and a growing Gen Z population in Canada, especially around universities and expanding job markets.
When looking at the population of Canada cities, Alberta is anchored by two major urban centres. Calgary, with around 1.6 million people, is the province’s largest city and a key economic hub, while Edmonton, home to about 1.2 million residents, serves as the provincial capital.


Manitoba
Manitoba is the easternmost of Canada’s Prairie Provinces and has a population that’s far more concentrated than its geography suggests.
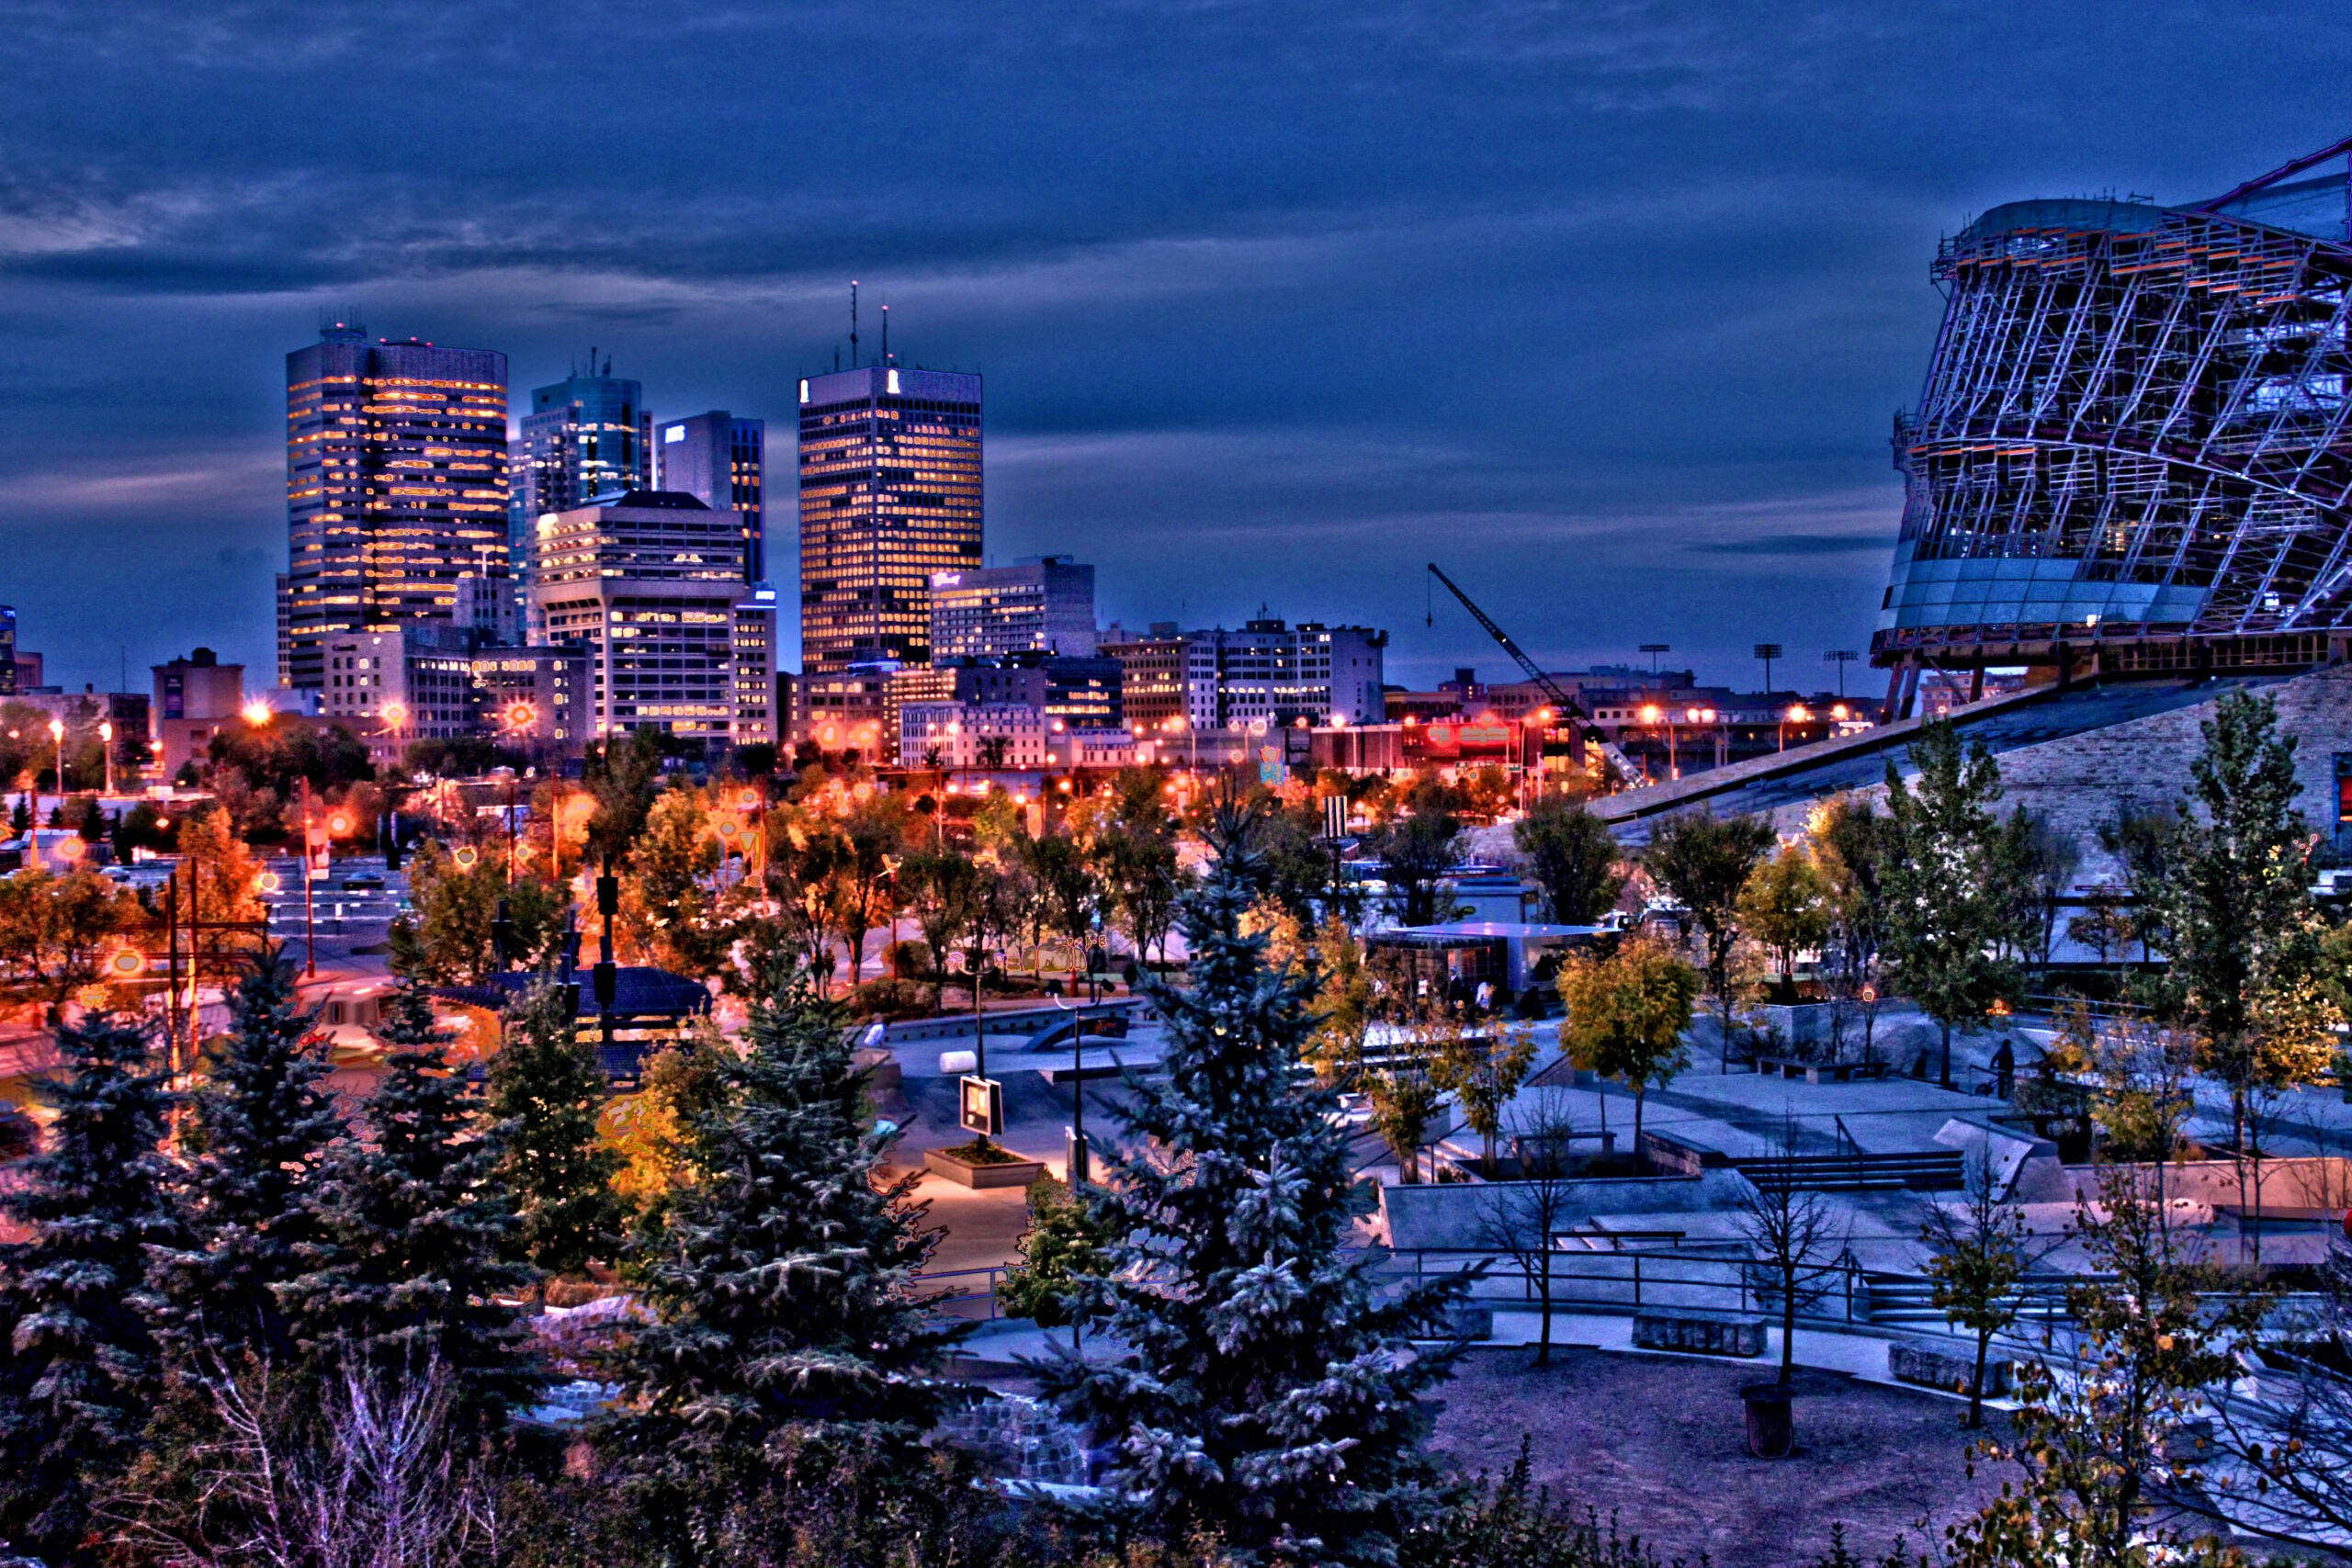
Most residents live in and around Winnipeg, which alone is home to more than 850,000 people, making it the clear centre of jobs, education, and services in the province.
The province has a relatively young population, with an average age of 39, and a nearly even gender split. One of Manitoba’s defining features is its strong Indigenous presence. Indigenous peoples make up over 18% of the population, one of the highest shares in Canada.
Manitoba’s population growth has been gradual and consistent rather than rapid. Growth has largely followed long-term settlement patterns, with Winnipeg driving most increases over time. Here's a short overview👇
1881
Approx. 62,300 residents
1901
Approx. 255,200 residents
1951
Approx. 776,500 residents
1981
Approx. 1 million residents
2001
Approx. 1.1 million residents
2024
Approx. 1.5 million residents
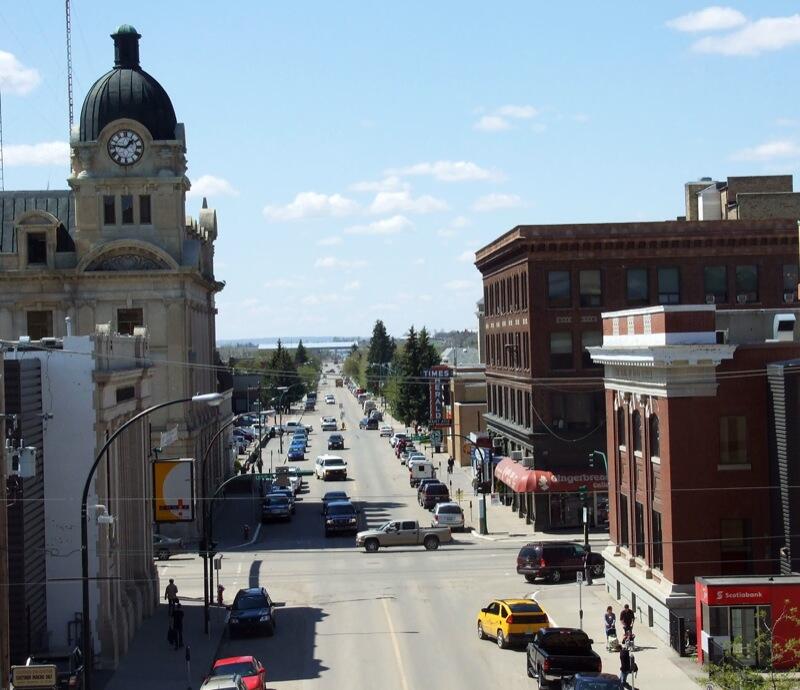
Saskatchewan
Saskatchewan is one of Canada’s prairie provinces, and its population looks very different from places like Ontario or British Columbia. With around 1.27 million people, the province accounts for about 3.2% of Canada’s total population.
Because Saskatchewan covers a huge land area, that works out to a very low population density, just 1.9 people per square kilometre.
The province has a fairly young population, with an average age of 39, and the split between men and women is almost even. Saskatchewan also has one of the largest Indigenous populations in Canada, which plays a major role in shaping its culture and demographics. In recent years, immigration has added to growth in the bigger cities, while many rural areas have stayed stable or grown slowly.


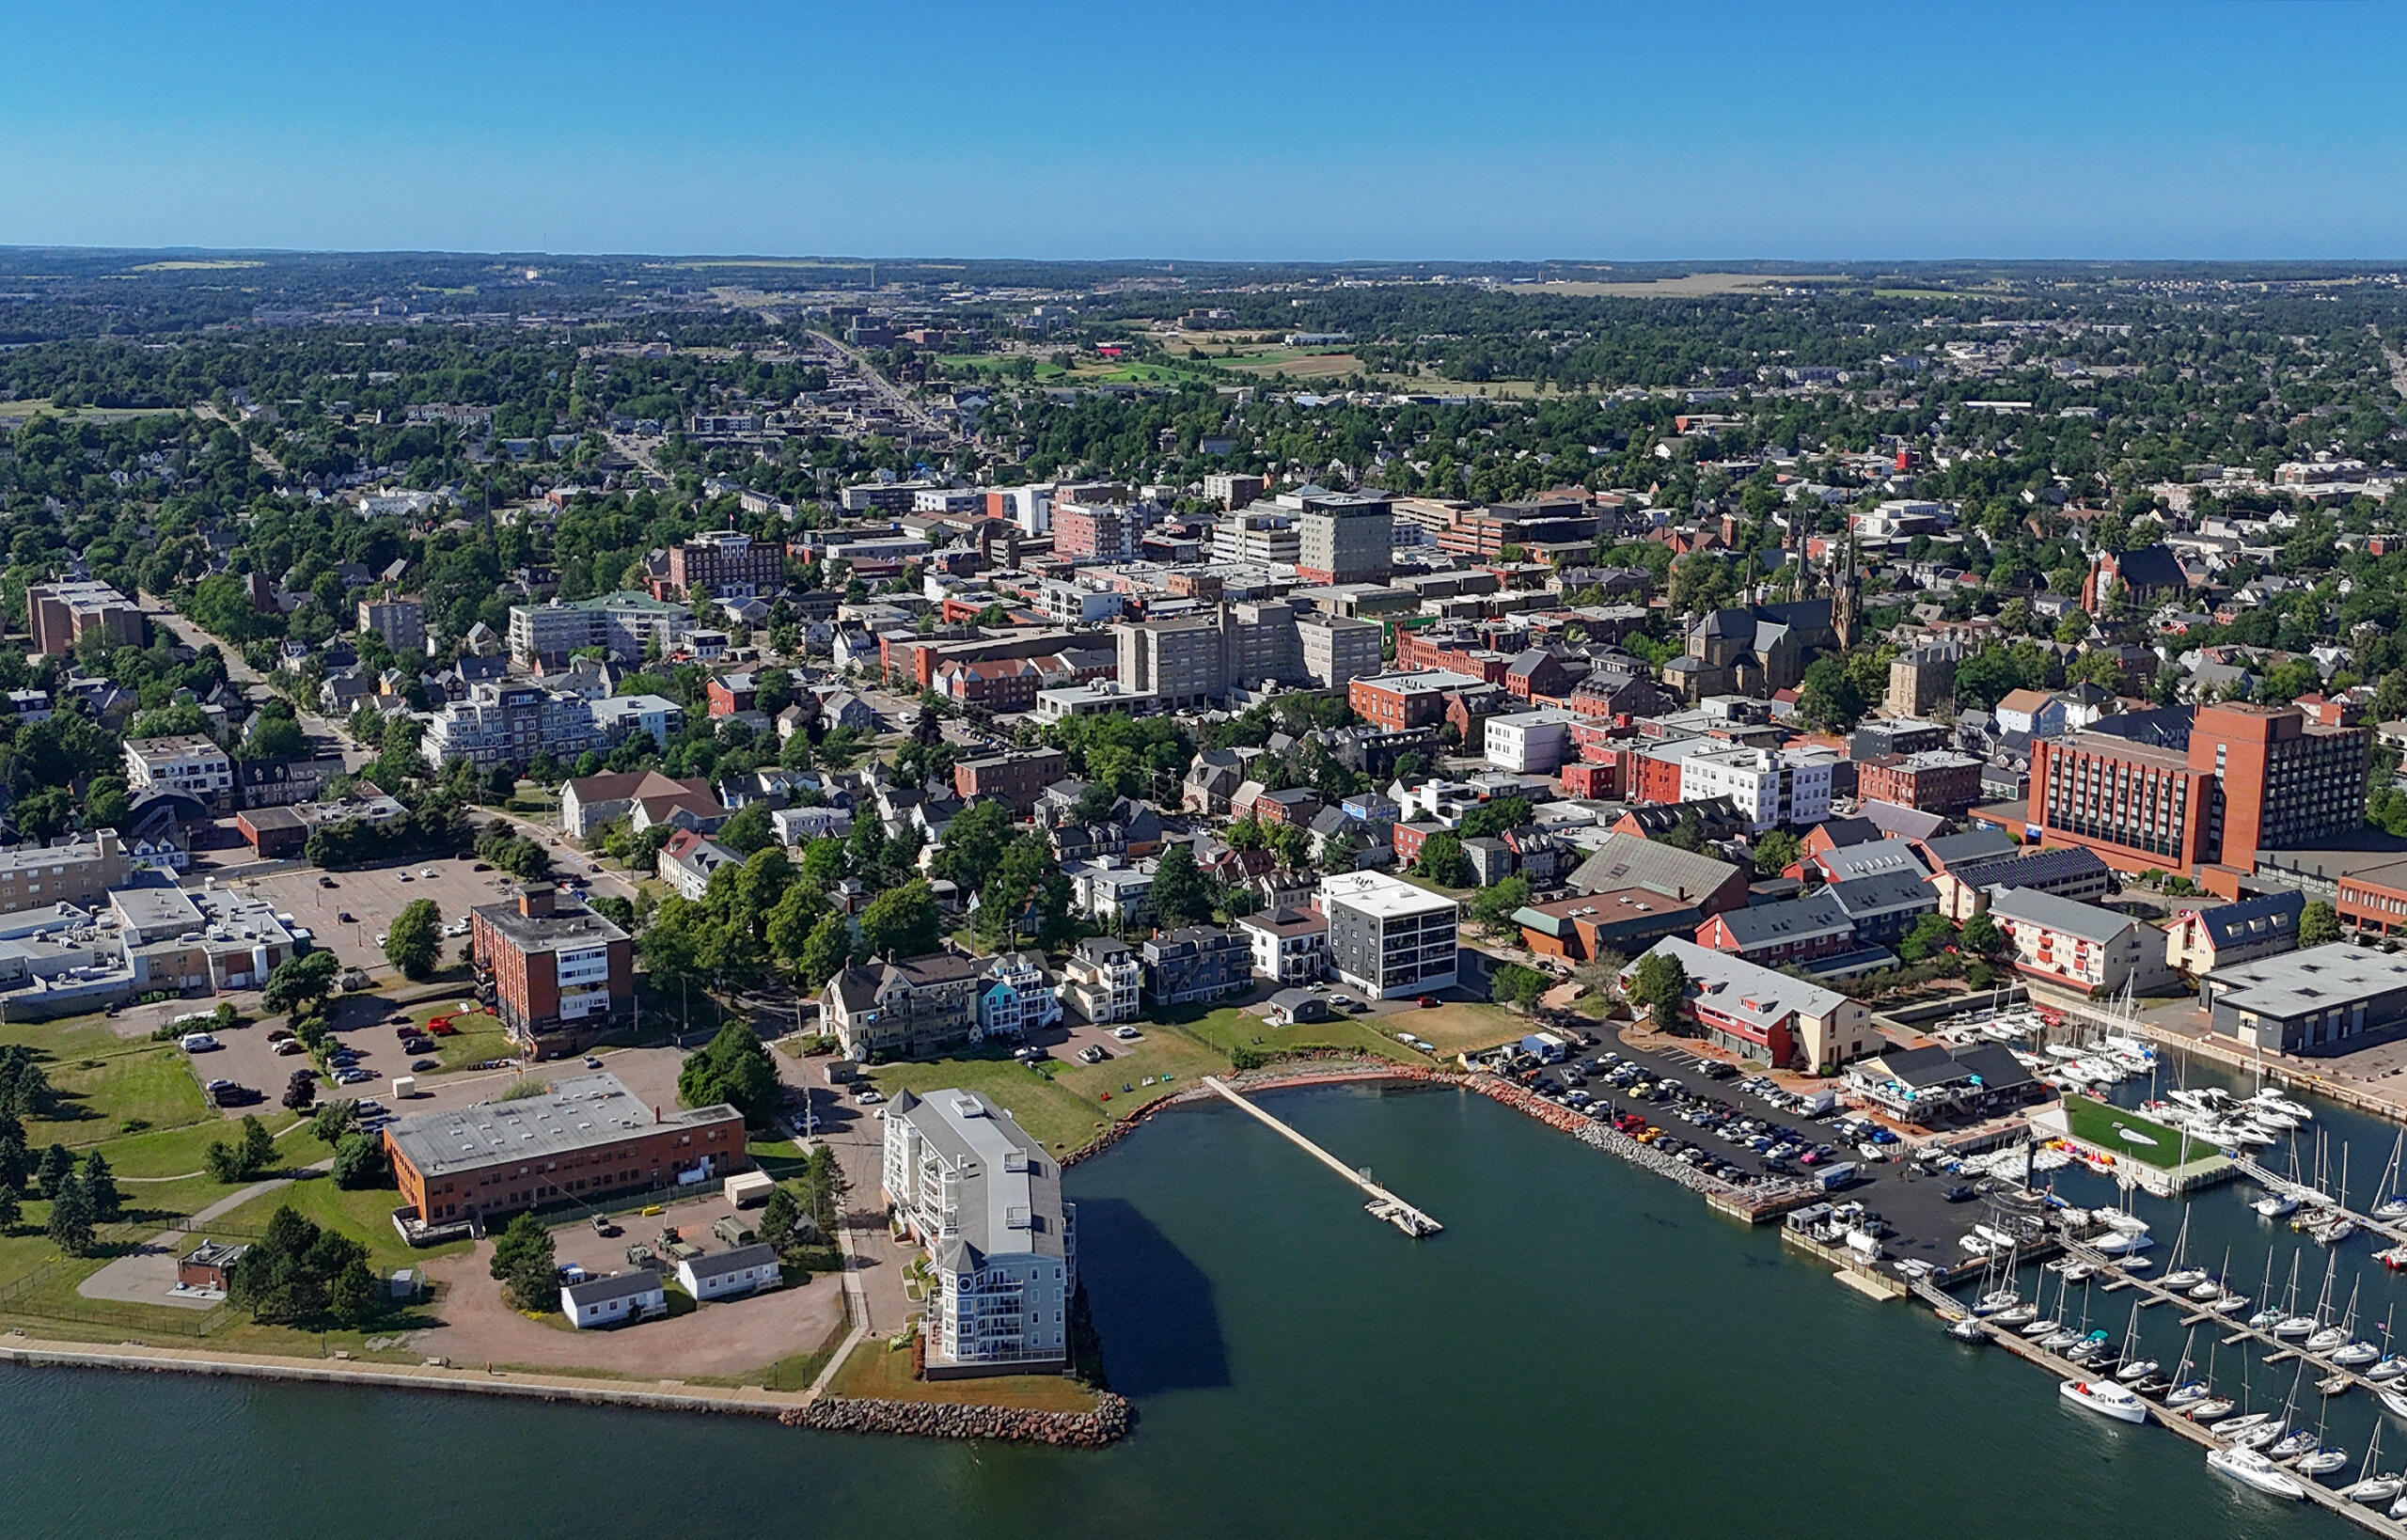
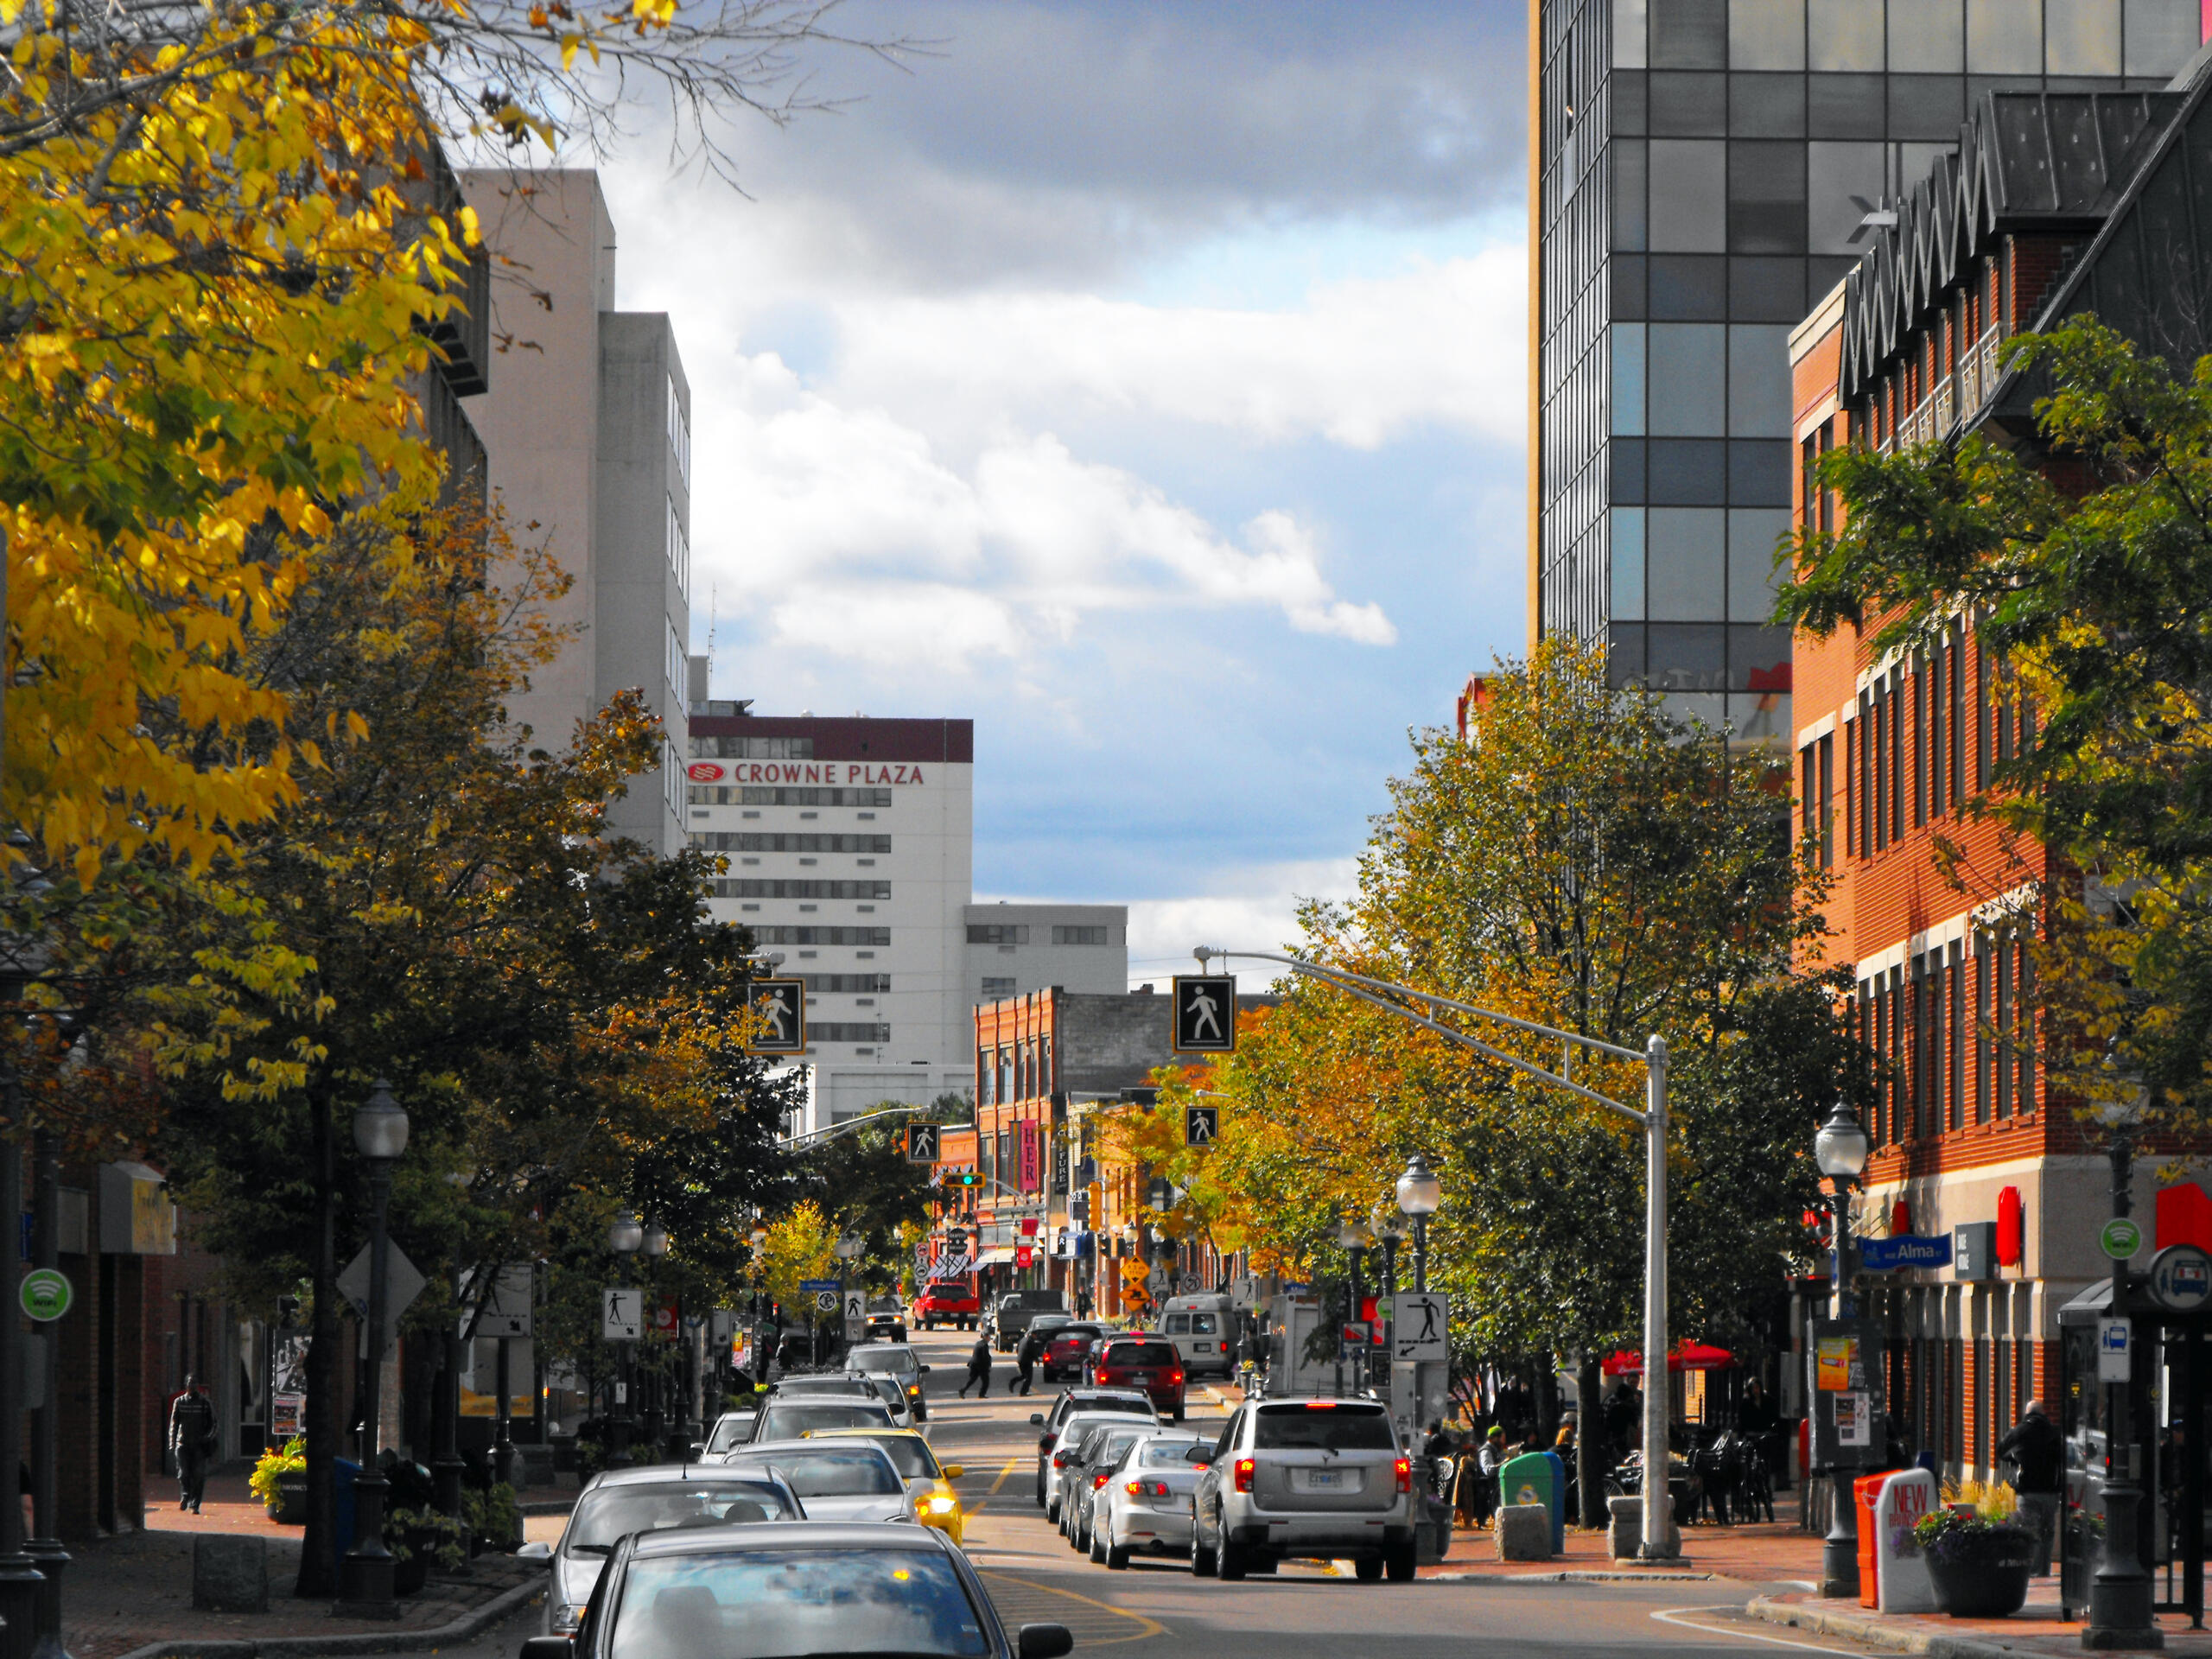
Atlantic Provinces
Canada’s Atlantic provinces tend to have smaller populations and older age profiles compared to the rest of the country. New Brunswick, Newfoundland and Labrador, and Prince Edward Island all have average ages in the mid-40s, reflecting long-standing trends of slower population growth and younger residents moving elsewhere for work or education.
Their populations are more evenly spread across smaller cities like Moncton, St. John's and Charlottetown, and they remain less urbanized than most central and western provinces.
The territories look very different by comparison. While Yukon, the Northwest Territories, and Nunavut have much smaller populations overall, they are noticeably younger. Nunavut stands out in particular, with an average age of just 27 and a population that is predominantly Inuit. In the territories, population change is driven less by immigration and more by natural growth, Indigenous communities, and work-related mobility.
Population Comparisons
To understand Canada’s population, it helps to look at comparisons. The sections below compare Canada with the United States and explore how people are distributed between urban and rural areas.
Canada vs. United States
Looking at Canada alongside other countries helps put its population size and growth into context. It makes it easier to see how different forces shape population change.
So compared with the population of Canada vs US, Canada remains much smaller overall, but has experienced growth in recent years, driven largely by migration rather than births.2 Broader national and international comparisons, including data from World Population Review’s breakdown of Canadian provinces by population, underline how these structural shifts continue to shape Canada’s population outlook. Below is a quick comparison of the Canadian population vs. US👇
| Indicator | Canada | United States |
|---|---|---|
| Total population | 41,575,585 (Q4 2025) | 348,120,740 (2025 est.) |
| Recent population trend | Growth slowed in 2025, including a quarterly decline in Q3 | Continued growth, but at a slower pace |
| Main driver of population change | International migration | Natural increase and migration |
| Median age | ~40.6 years | ~39.1 years |
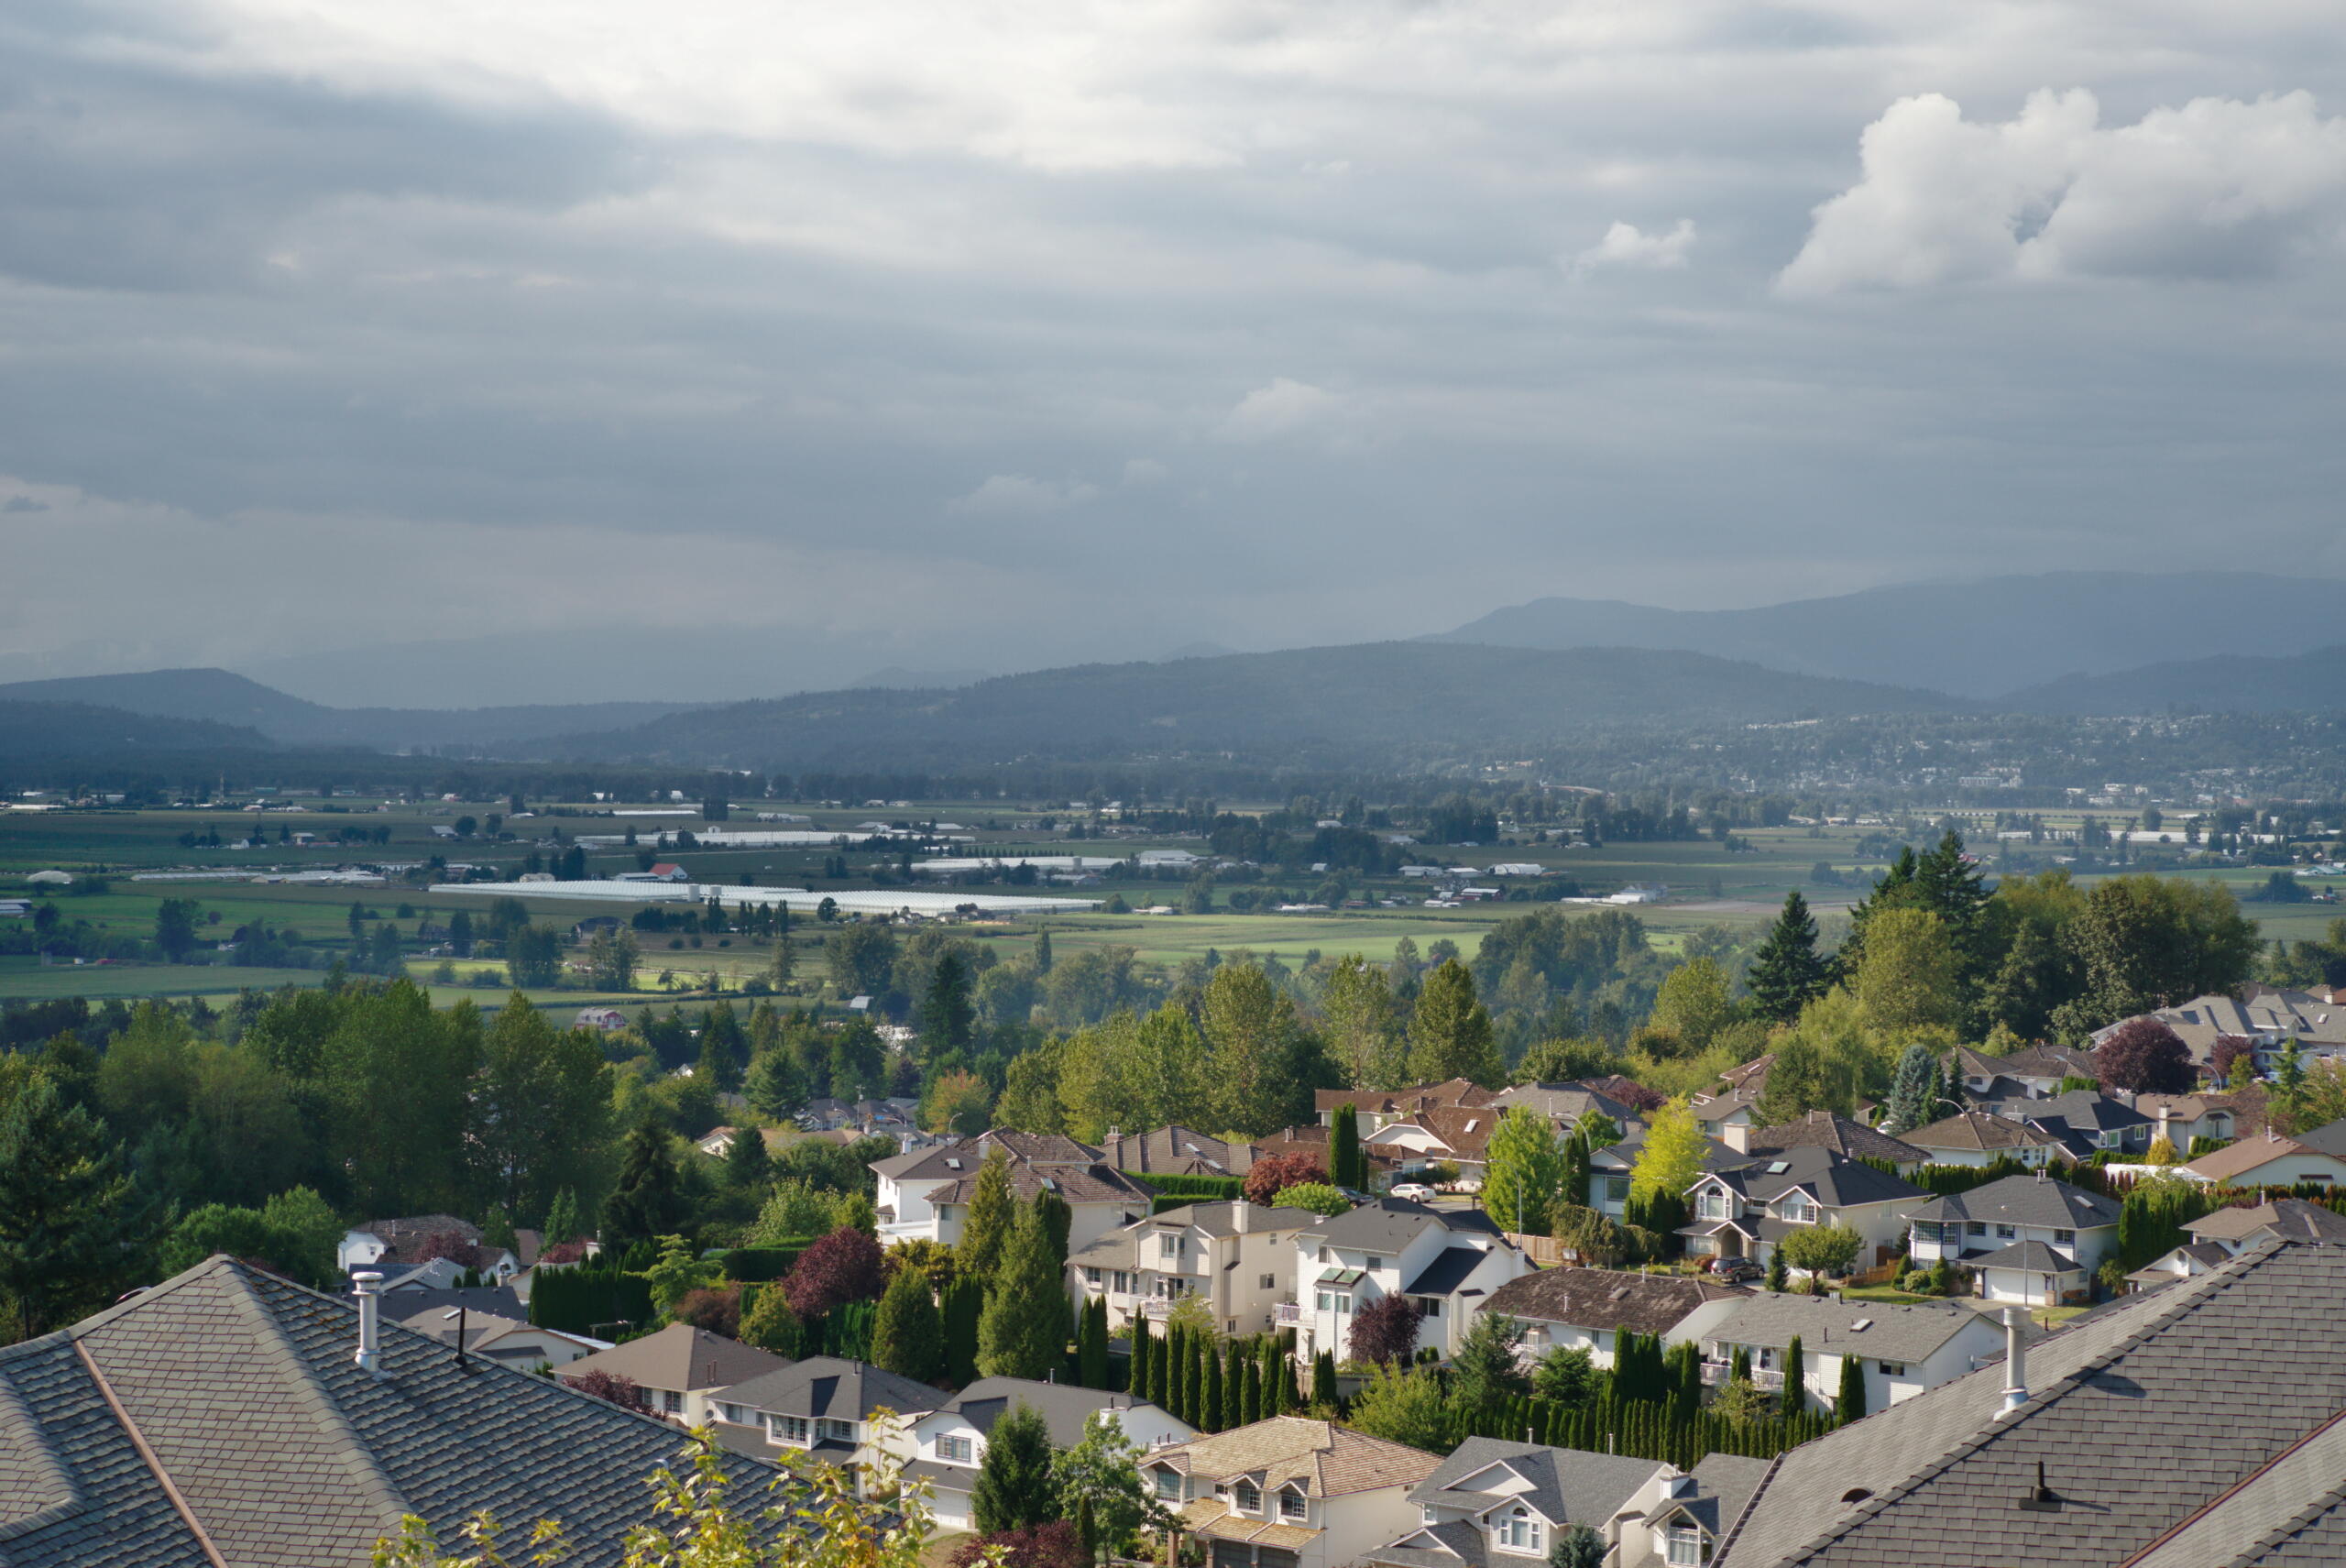
Urban vs. Rural Populations
Canada’s population is heavily concentrated in urban areas, with most people living in or near large cities rather than rural regions. Metropolitan areas like Toronto, Vancouver, Montréal, Calgary, and Edmonton continue to attract residents thanks to stronger job markets, universities, and access to services.
Rural regions, on the other hand, are often more sparsely populated and tend to grow more slowly. While they may offer lower housing costs and a different quality of life, fewer employment opportunities and limited access to services can make it harder to attract and retain residents. As a result, the gap between urban and rural population growth continues to widen across many provinces.
Interactive Population Map
Population Growth Over Time
Canada’s population growth follows a simple formula: births minus deaths (natural increase) plus immigration minus emigration (migratory increase). While the math is straightforward, what actually drives growth has changed a lot over time.
For much of Canada’s history, population growth came mainly from natural increase. High birth rates meant the population grew even when more people were leaving the country than entering. That started to change in the late 1960s, as fertility rates fell and the population began to age.
Today, natural increase plays a much smaller role. According to Statistics Canada, it now accounts for less than one-third of population growth, while migratory increase makes up roughly two-thirds. In other words, Canada’s population growth now depends mostly on immigration rather than births.
This shift became especially clear after COVID-19. While border closures briefly slowed growth, population numbers rebounded once migration resumed. Statistics Canada projections show that without sustained immigration, Canada’s population growth could slow to near zero within the next 20 years, as deaths rise and birth rates remain below the replacement level of 2.1 children per woman.4
Looking ahead, migration is expected to play an even larger role. Under current projection scenarios, more than 80% of Canada’s future population growth could come from migratory increase starting in the 2030s, making immigration the main engine behind long-term growth.
References
- Government of Canada, S.C. (2025a) Annual demographic estimates: Canada, provinces and Territories, Government of Canada, Statistics Canada. Available at: https://www150.statcan.gc.ca/n1/en/catalogue/91-215-X.
- Government of Canada, Statistics Canada (2025) Population Estimates, quarterly, Population estimates, quarterly. Available at: https://www150.statcan.gc.ca/t1/tbl1/en/tv.action?pid=1710000901.
- Bureau, U.C. (2025) Population of United States, Census.gov. Available at: https://www.census.gov/programs-surveys/popest.html.
- Government of Canada, S.C. (2024) Population growth: Migratory increase overtakes natural increase, Government of Canada, Statistics Canada. Available at: https://www150.statcan.gc.ca/n1/pub/11-630-x/11-630-x2014001-eng.htm.
Summarize with AI:
Did you like this article? Leave a rating!